20-March-2024
It has been almost two months now, that I have been working on a new small project, and most of the work is done in my free time only. This project is centered around visualizing Maths, to be fair, only a few Mathematical Concepts so far.
The idea for working on this project came from a simple realization that equations can look something close to gibberish. But once I get to witness them on a graph, they suddenly start to mean something beyond what I had previously understood. I can see the essence behind these equations.
I am aware that there already exists a bunch of free and paid software that can graph almost any equation that you can come up with. I also find myself using Desmos quite frequently. This is why I don't have any revolutionary expectations or intentions from this project, I would be glad even if my classmates get help from this project.
Visualizing the equation is not the only part of the process of working on this project, Interactiveness is also an essential part of this project. It is so that when using it, we can see how the equation behaves with the changing inputs.
Initial Visualisations
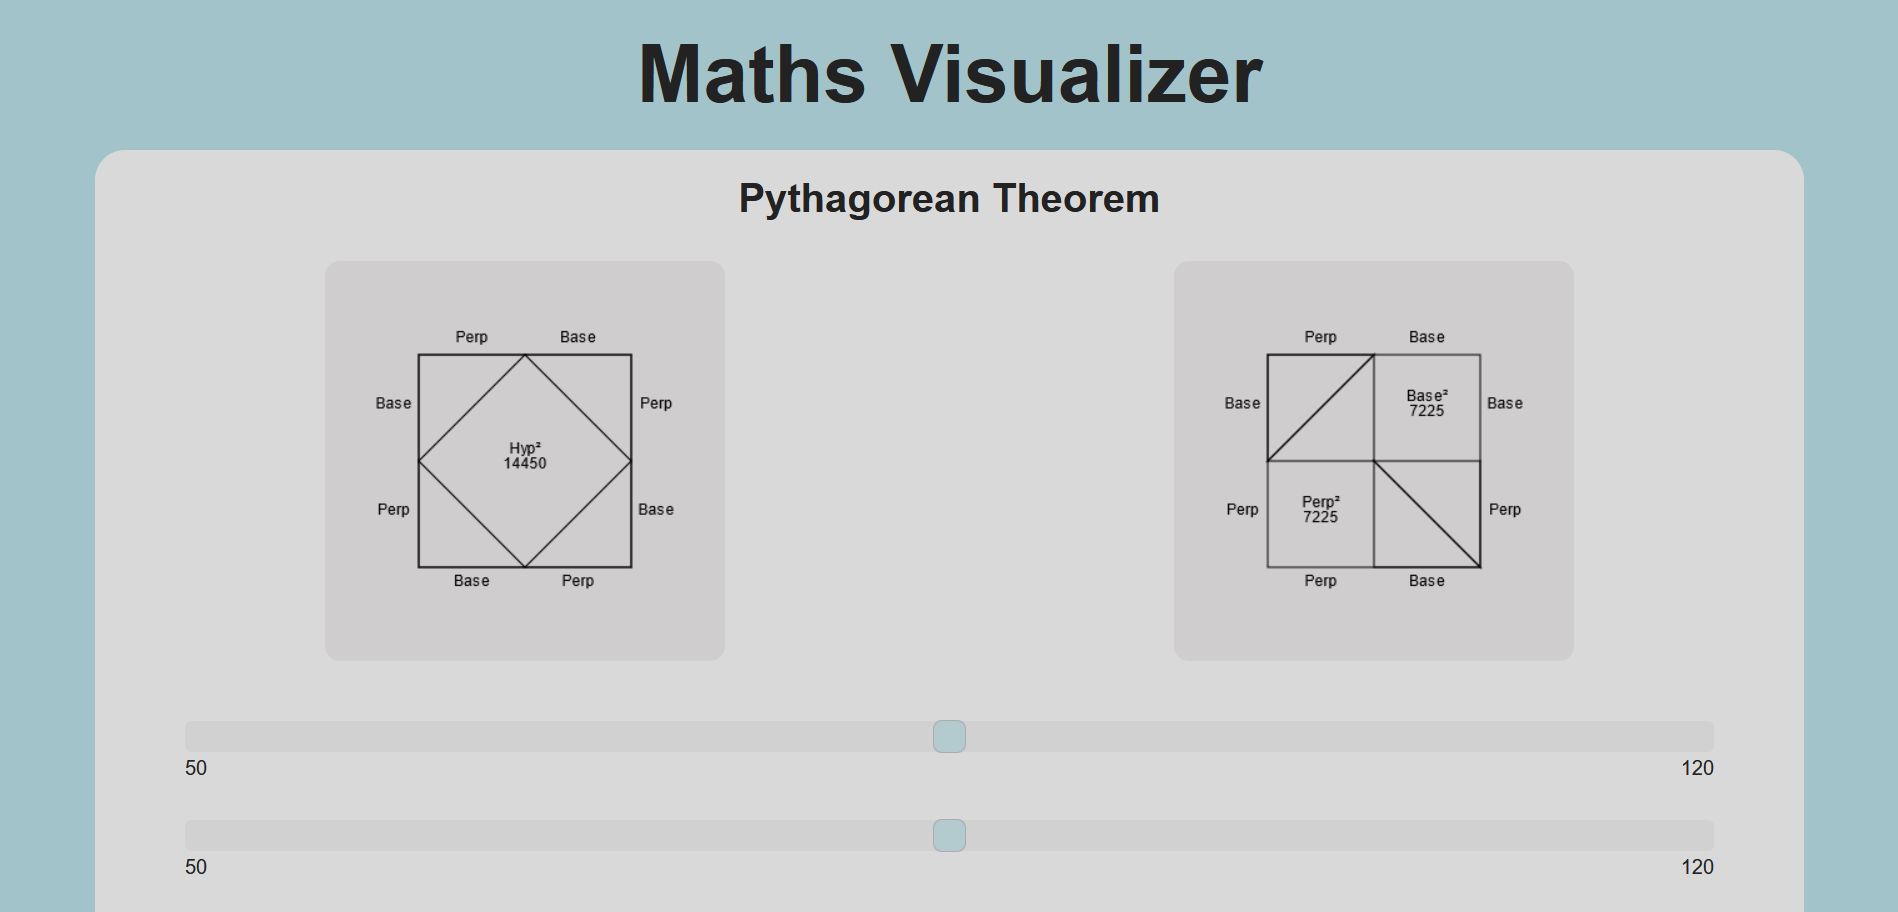
The first visualization that was implemented in this project was of the Pythagorean Theorem by visualizing the area of Base2, Perp2, and Hyp2.
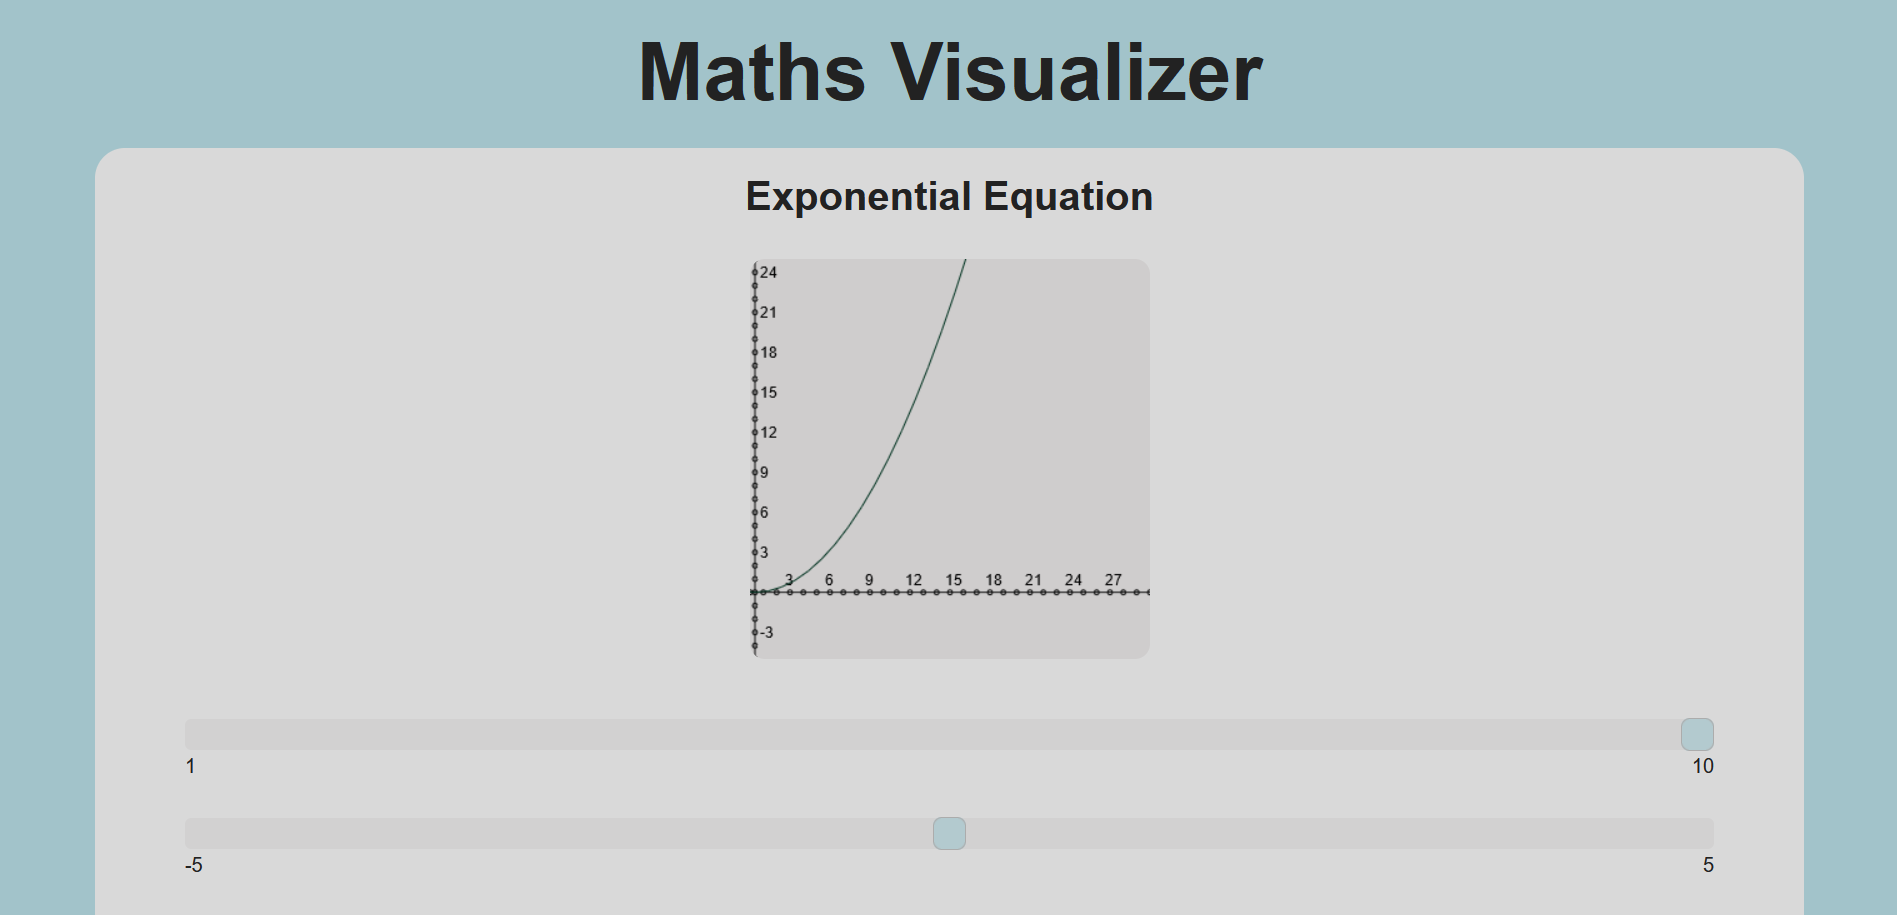
Then visualization of Linear Equation was implemented. Then, visualizations for the Exponential Equation, Logarithmic Equation, and Solution of 2 Linear Equations were implemented, and so far, a few more visualizations have been implemented.


Why is it still Private?
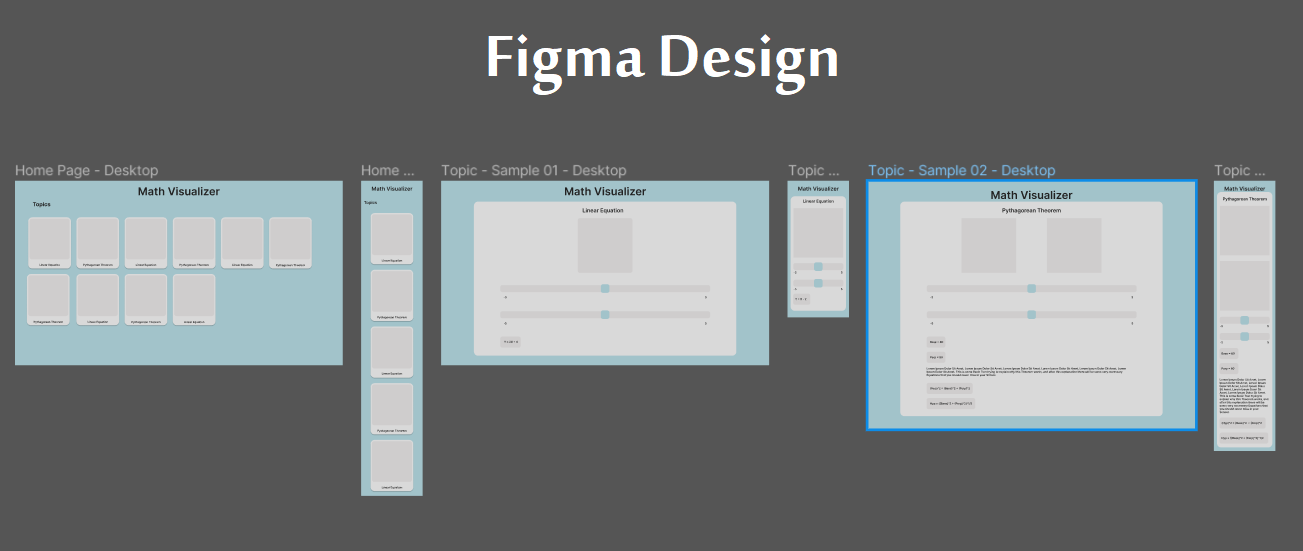
I still haven't made the project public because of a few things that I am not sure whether I want to change or not, for example, the design of the Home Page, and the design of an explanation with canvas on mobile. But one other reason is that I don't have a creative Name for the project, so far I have only been using “Math Visualizer” as a placeholder text in HTML and Figma.
I will try to get these things in order and will make this project public as soon as I can.
